
KEY METRICS
APS country benchmark:
73.6 points
FANs% score benchmark:
78% or more
CRITICs% score benchmark:
11% or less
APS country average score:
43.9 points
MARKET LEADERS
COPEC led the survey with an APS score of 83.1, earning a High Performance rating. MERCADO PAGO: CUENTA DIGITAL followed at 79.2, while WESTERN UNION ENVÍO DE DINERO scored 73.6; both ranked Strong.
That third-place score also represents the survey’s supplied APS benchmark for competitive, above-average performance. Alongside it, the target is a Fans% score of at least 78% and a Critics% score of no more than 11%. These thresholds give product teams a more demanding reference than simply clearing the country average.
The strategic implication is clear: benchmark against the leading experiences while measuring both advocacy and dissatisfaction. The opportunity is to turn uneven satisfaction into a more consistently positive experience across the surveyed app market.
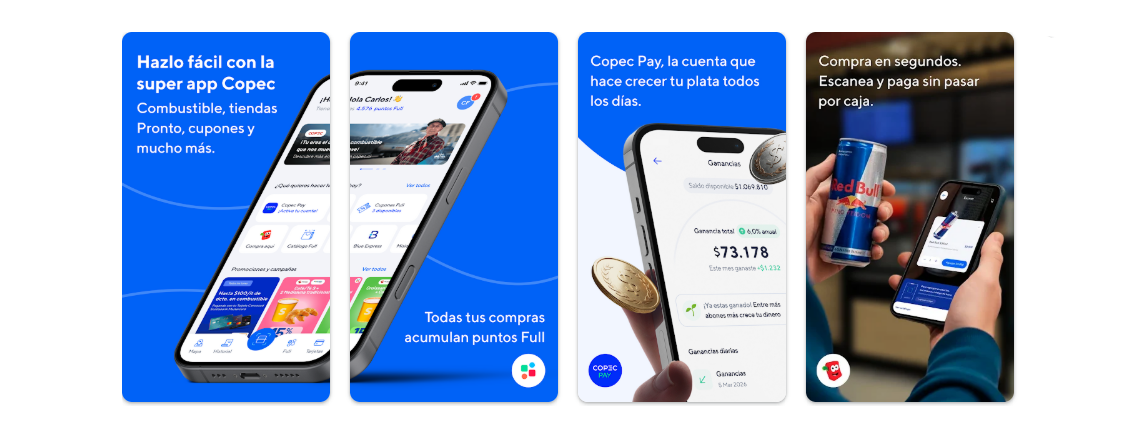
COPEC
83.1 points
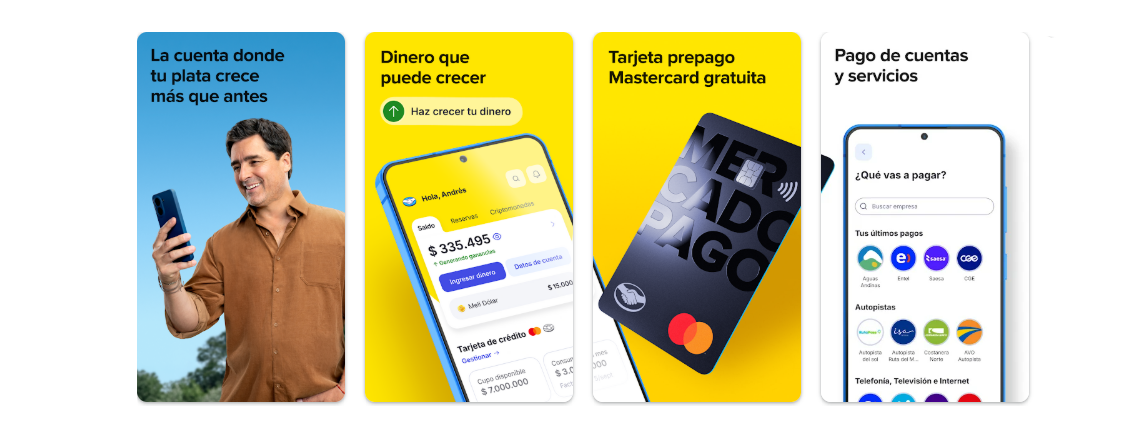
MERCADO PAGO
79.2 points
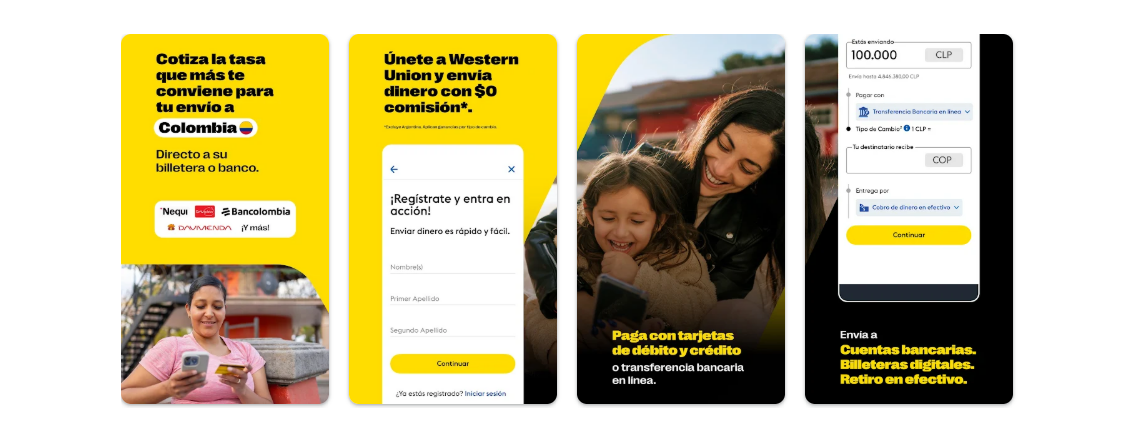
WESTERN UNION
73.6 points
MARKET OVERVIEW
Chile’s October 2026 Banking & Fintech Apps User Satisfaction Survey analyzed more than 10.000 valid responses across 20 apps. The survey uses APS from Cassuarina Labs—App Pulse Score© (APS)—to translate respondents’ qualitative feedback into a user-satisfaction index.
The average APS score across the apps evaluated was 44, placing the surveyed market in the Developing performance level. This indicates mixed performance and an inconsistent user experience. For product teams, the challenge is to make satisfaction dependable across the customer experience.
Based on the average satisfaction distributions derived from respondents’ responses and comments across all evaluated apps, 54.4% of feedback fell into “Love It” (81–100), 5.1% into “Very disappointed” (21–40), and 30.7% into “Frustrated” (0–20). These are cross-app averages, rather than a claim about every app or all Chilean users. Survey results show a divided experience: strong enthusiasm coexists with a substantial concentration of frustration.
The spread of app performance reinforces that divide. One app reached High Performance, three were Strong, one Solid, three Moderate, three Developing, two Underperforming, two Vulnerable, and five Severely vulnerable. The largest single group sits near the lower end of the performance scale, suggesting that the market’s leading experiences remain far from the norm.
The product lesson is to evaluate positive sentiment and dissatisfaction together. A strong base of enthusiastic respondents does not, by itself, establish consistent performance. Teams should use qualitative survey feedback to identify where experiences diverge and prioritize the problems behind the weakest outcomes.
DOWNLOADS
App Metrics Dataset - APS REPORT
Compare mobile app user satisfaction with detailed results for each app from the survey. The report includes valid response counts, average APS score, FANs%, CRITICs%, App Score Index, score versus the survey average and app’s APS performance rating.
CHILE BANKING APP METRICS DATASET - OCTOBER 2026 (exclusive content)
User Satisfaction Survey Dataset
Explore the full qualitative feedback for every app analyzed. Real user comments reveal the experiences, expectations, and frustrations behind the scores, helping you identify strengths and opportunities for improvement.
The report provides detailed, validated user comments and specific responses for each app; these can be verified internally if the app is your own, or checked online if it is another app.
CHILE - BANKING & FINTECH APPS USER SATISFACTION SURVEY - App Pulse Score© (APS)